7e. Predictor paths and civic anchors
Overview
This page handles §4.4 (what drives receptivity) and §4.5 (real-world correlates) of the policy report. The only new analysis pass is the country-stratified predictor–FIMI alignment (R/policy_report/08_country_stratified_sem.R); everything else is reshape work over CSVs already produced upstream.
| Figure / output | Title | Source | Status |
|---|---|---|---|
| §4 (roadmap) |
compute_country_predictor_paths() → s4_country_predictor_paths.csv, s4_country_predictor_rank.csv
|
S4 items parquet + pooled COMP fit at outputs/prediction_models/fimi_prediction/s4_pred_comp_full.rds
|
Implemented |
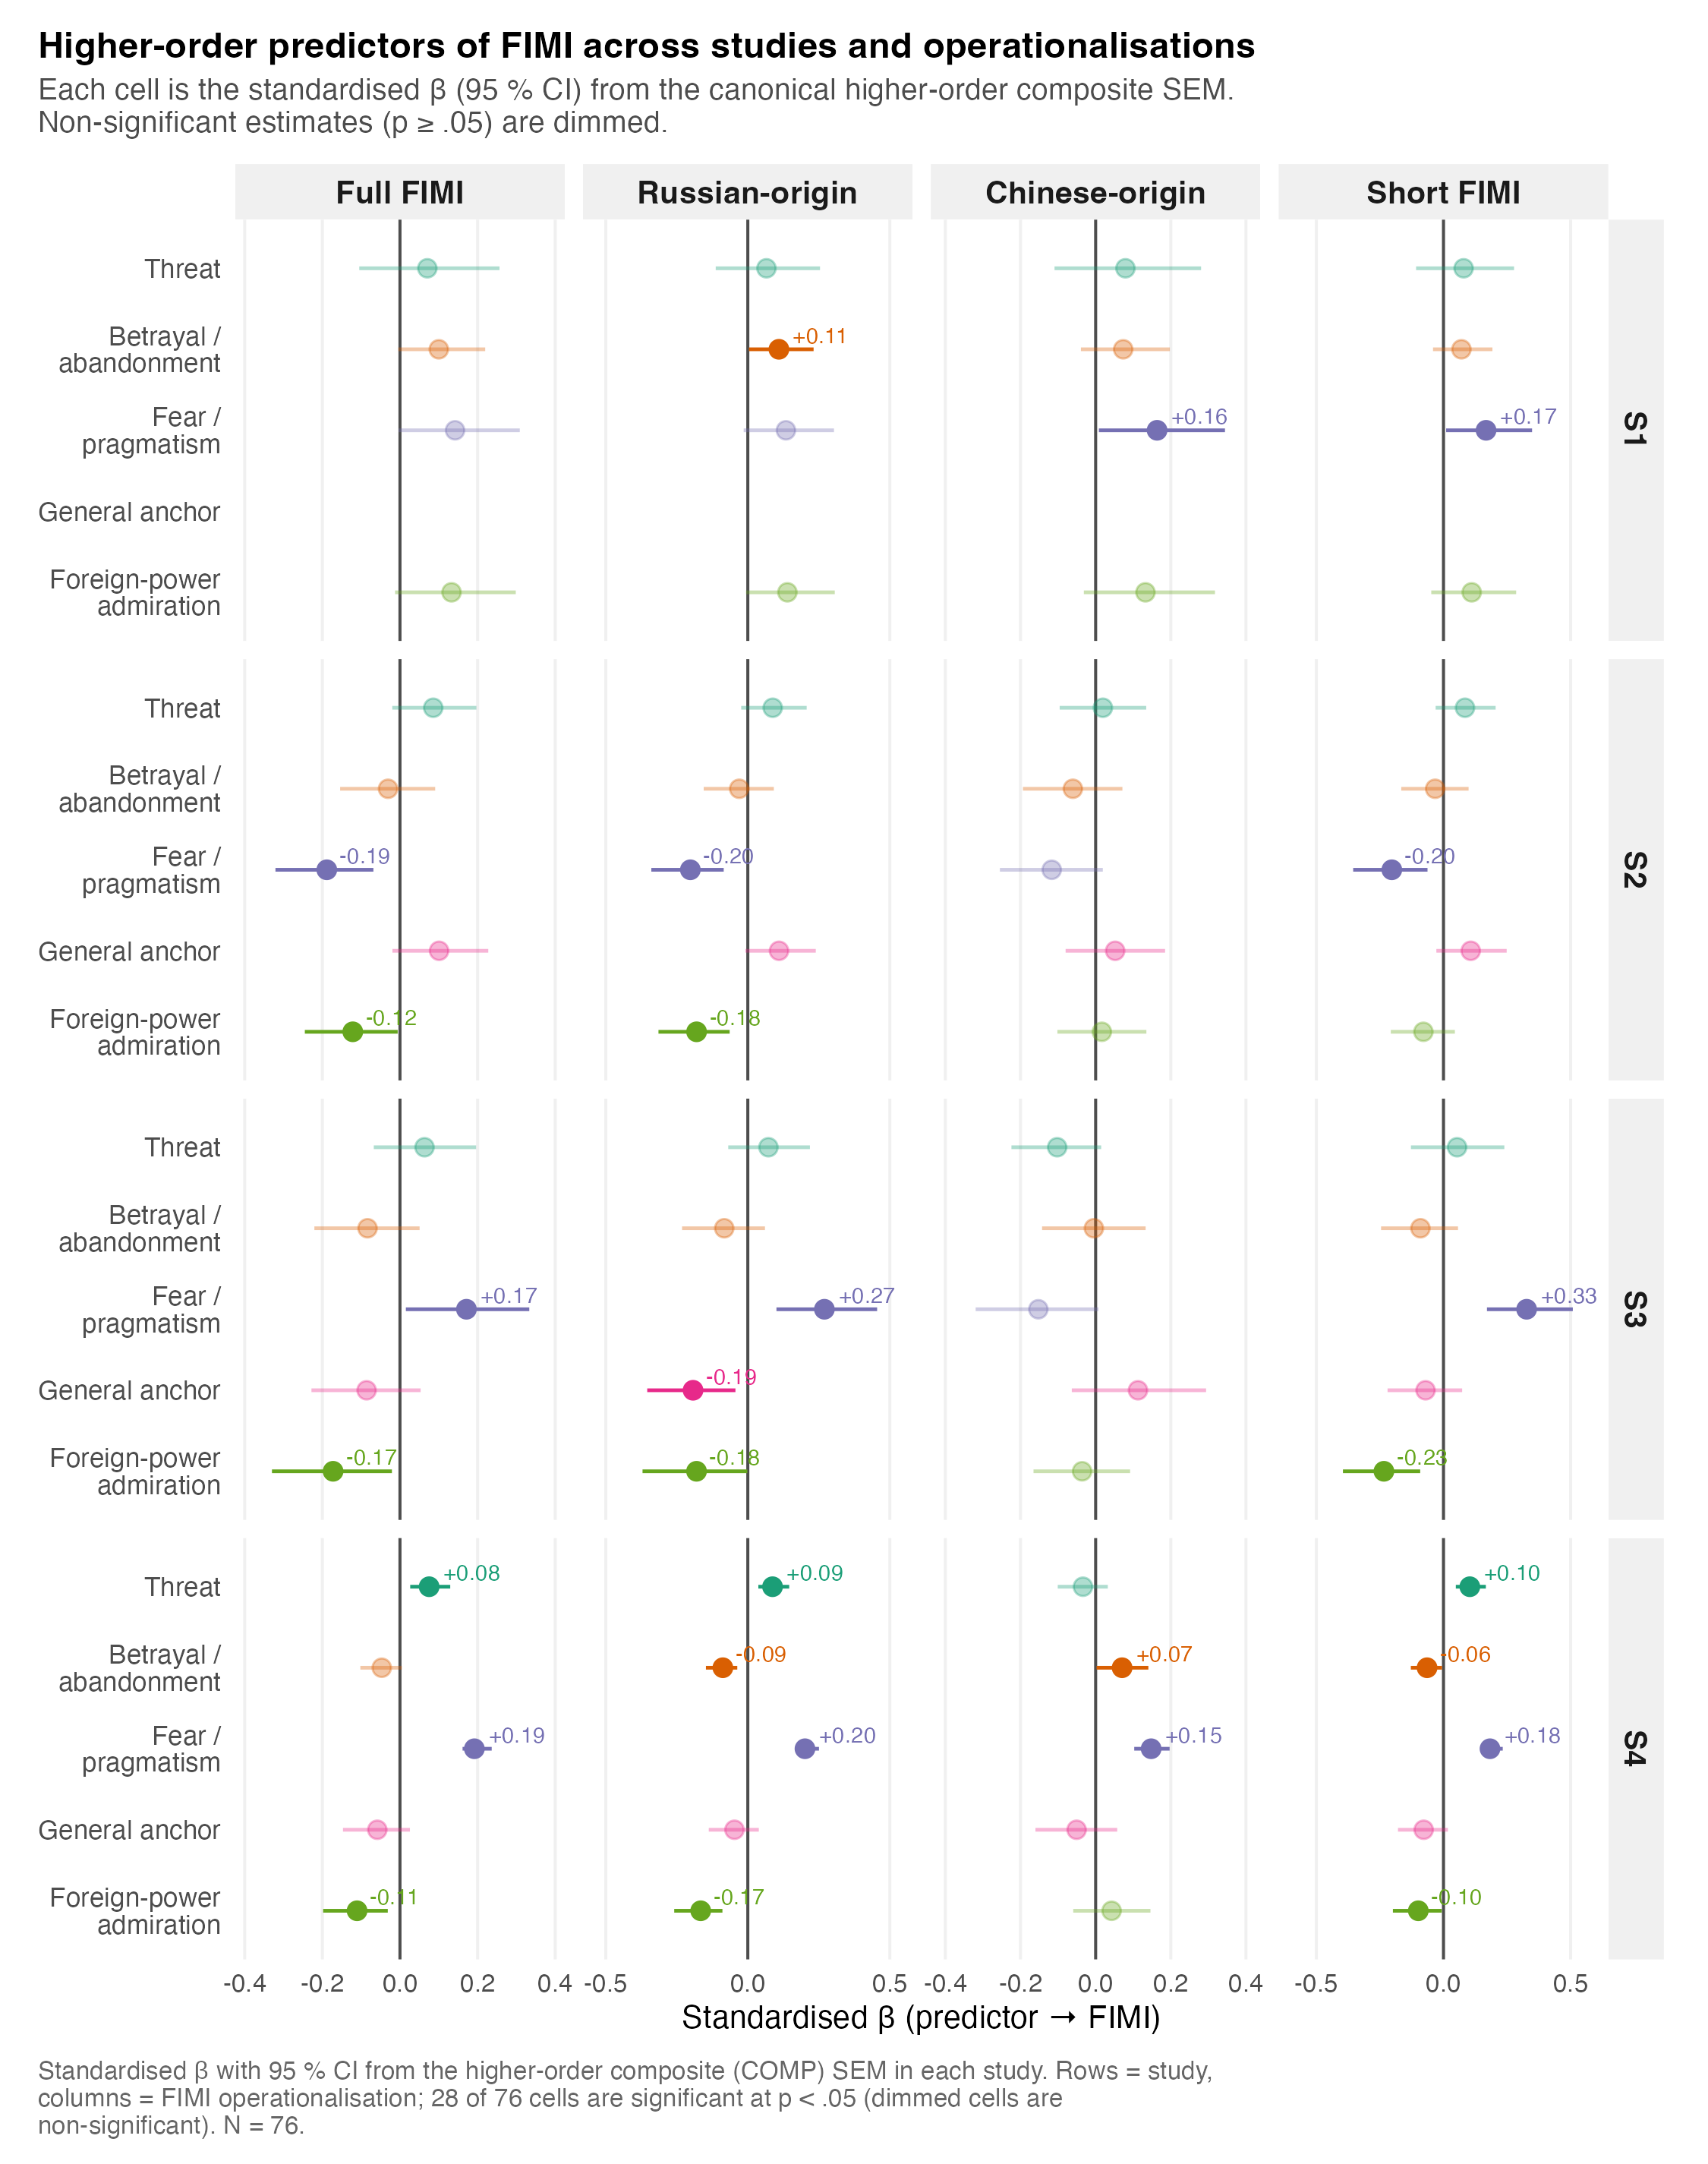
| F-18 | Forest plot: higher-order predictors → FIMI |
fimi_prediction_paths_for_forest.csv (via assemble_forest_data()) |
Skeleton |
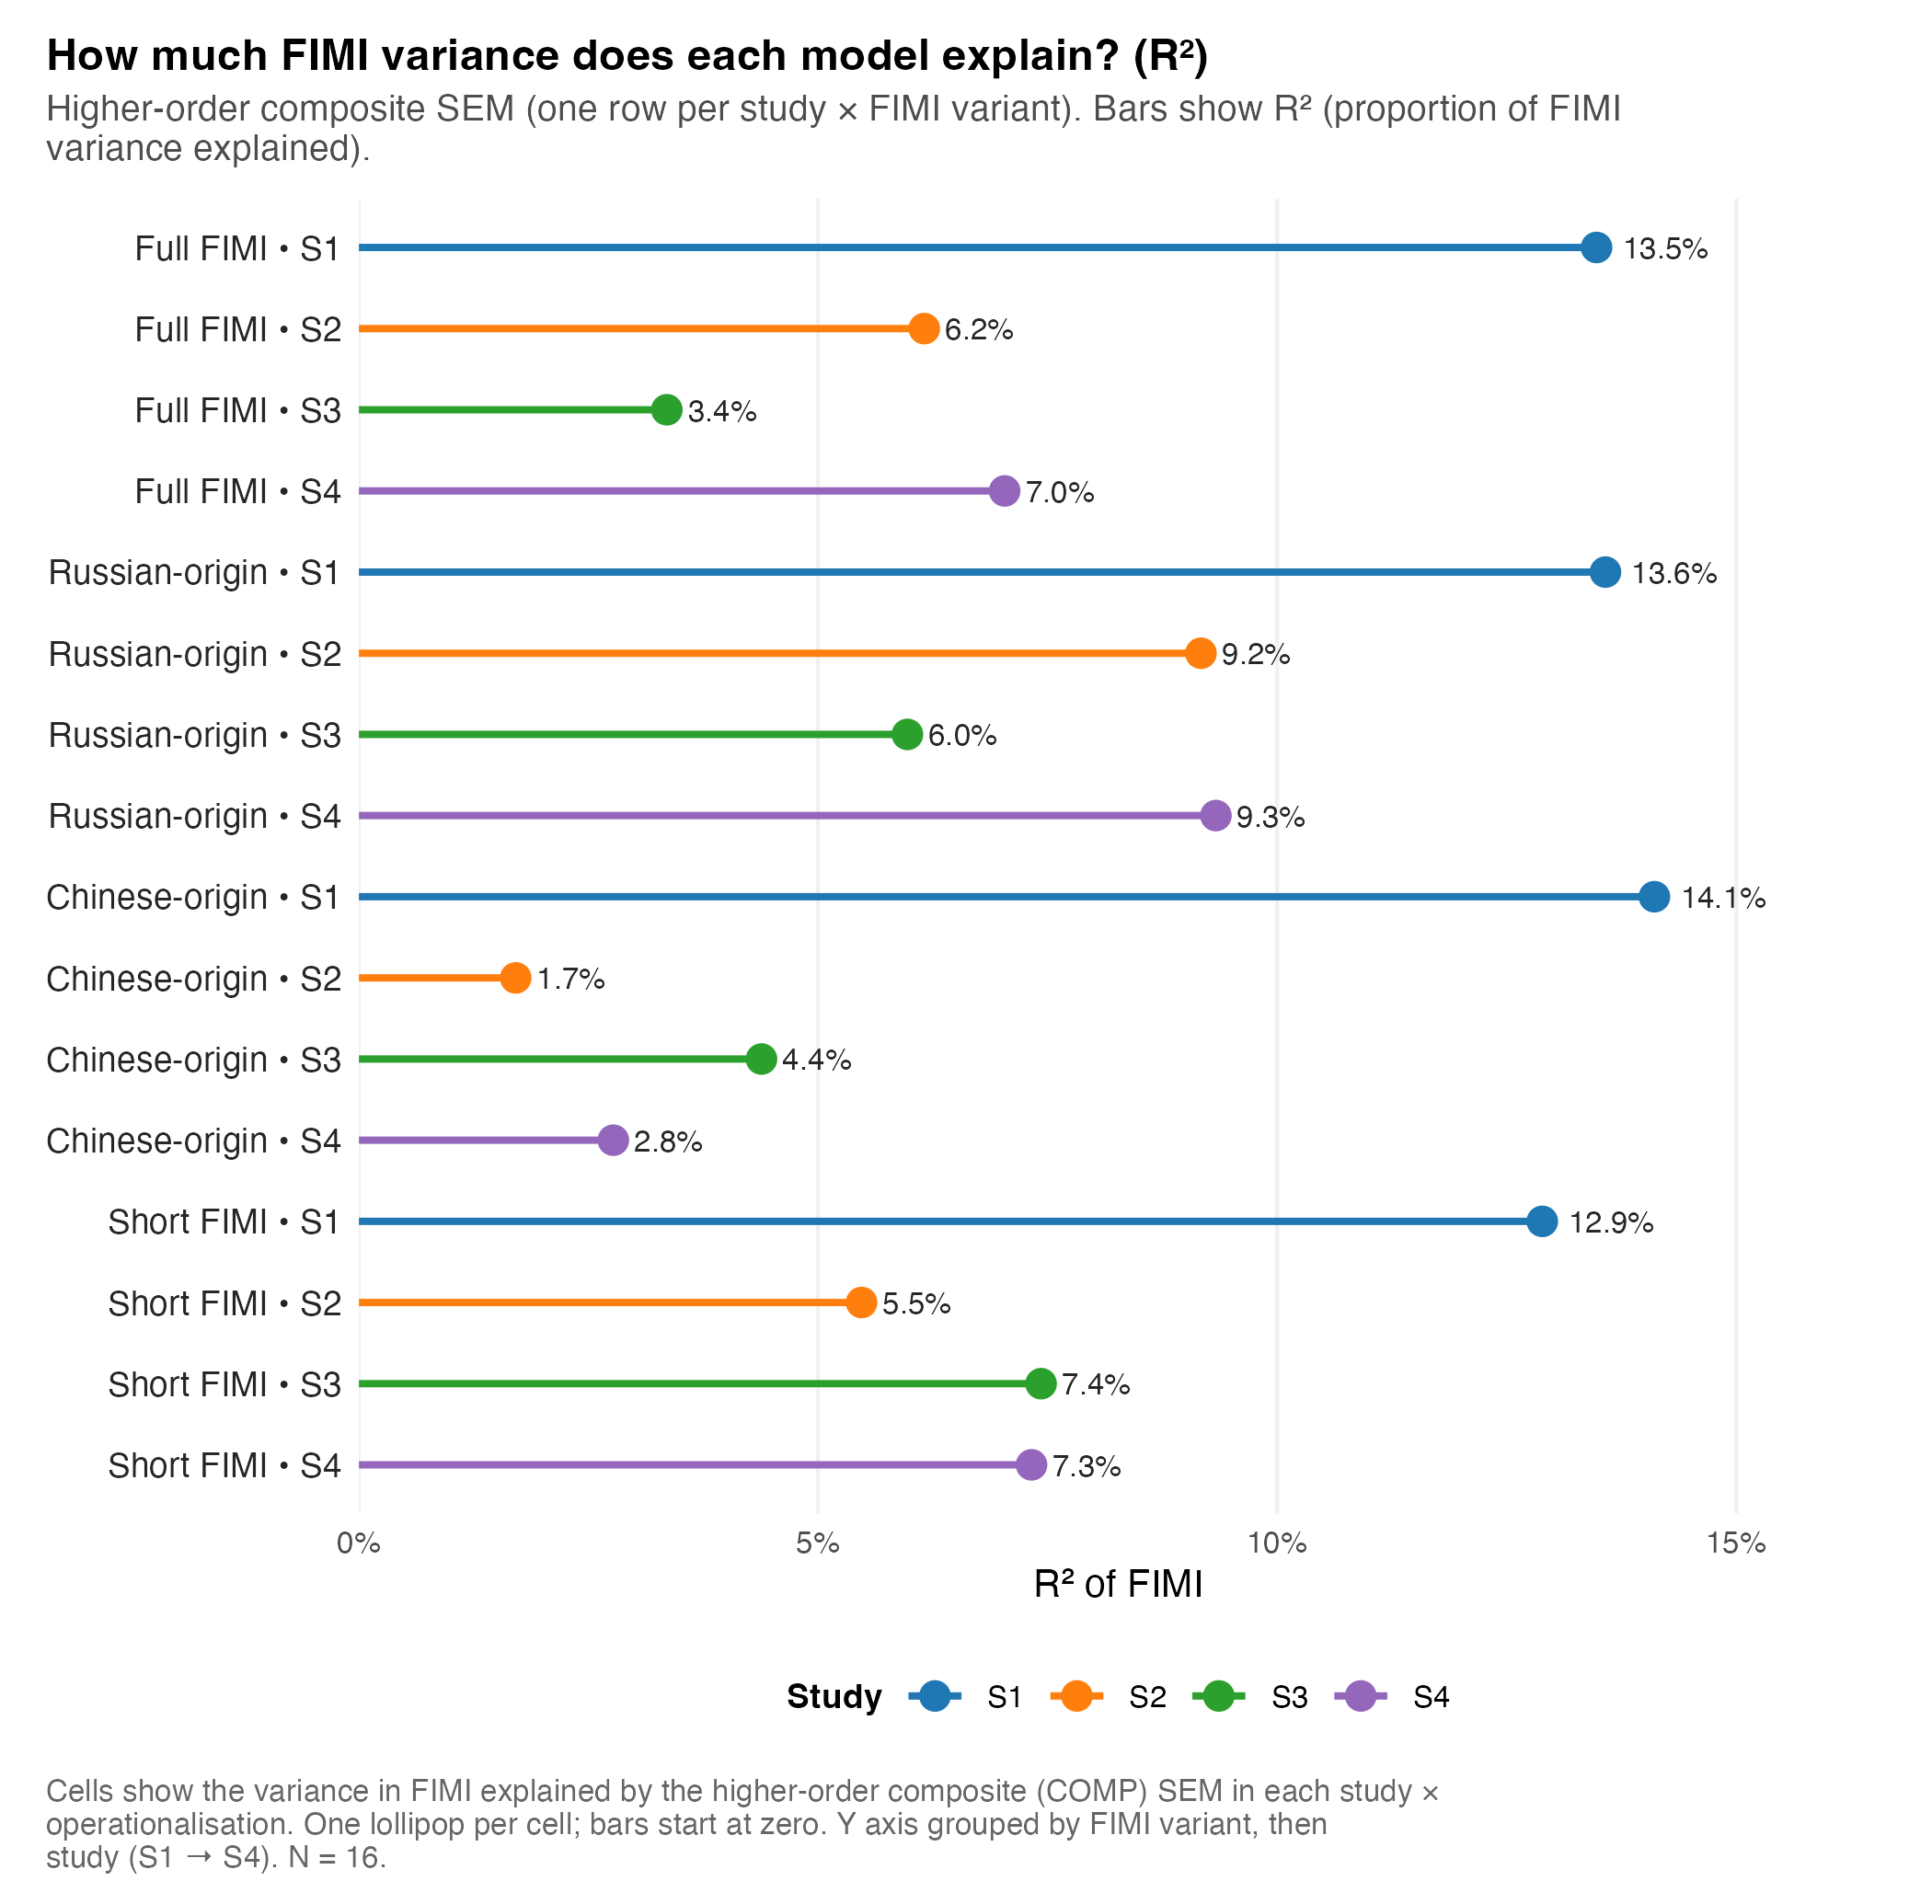
| F-19 | R² lollipop across studies and FIMI versions | outputs/tables/fimi_prediction_r2.csv |
Skeleton |
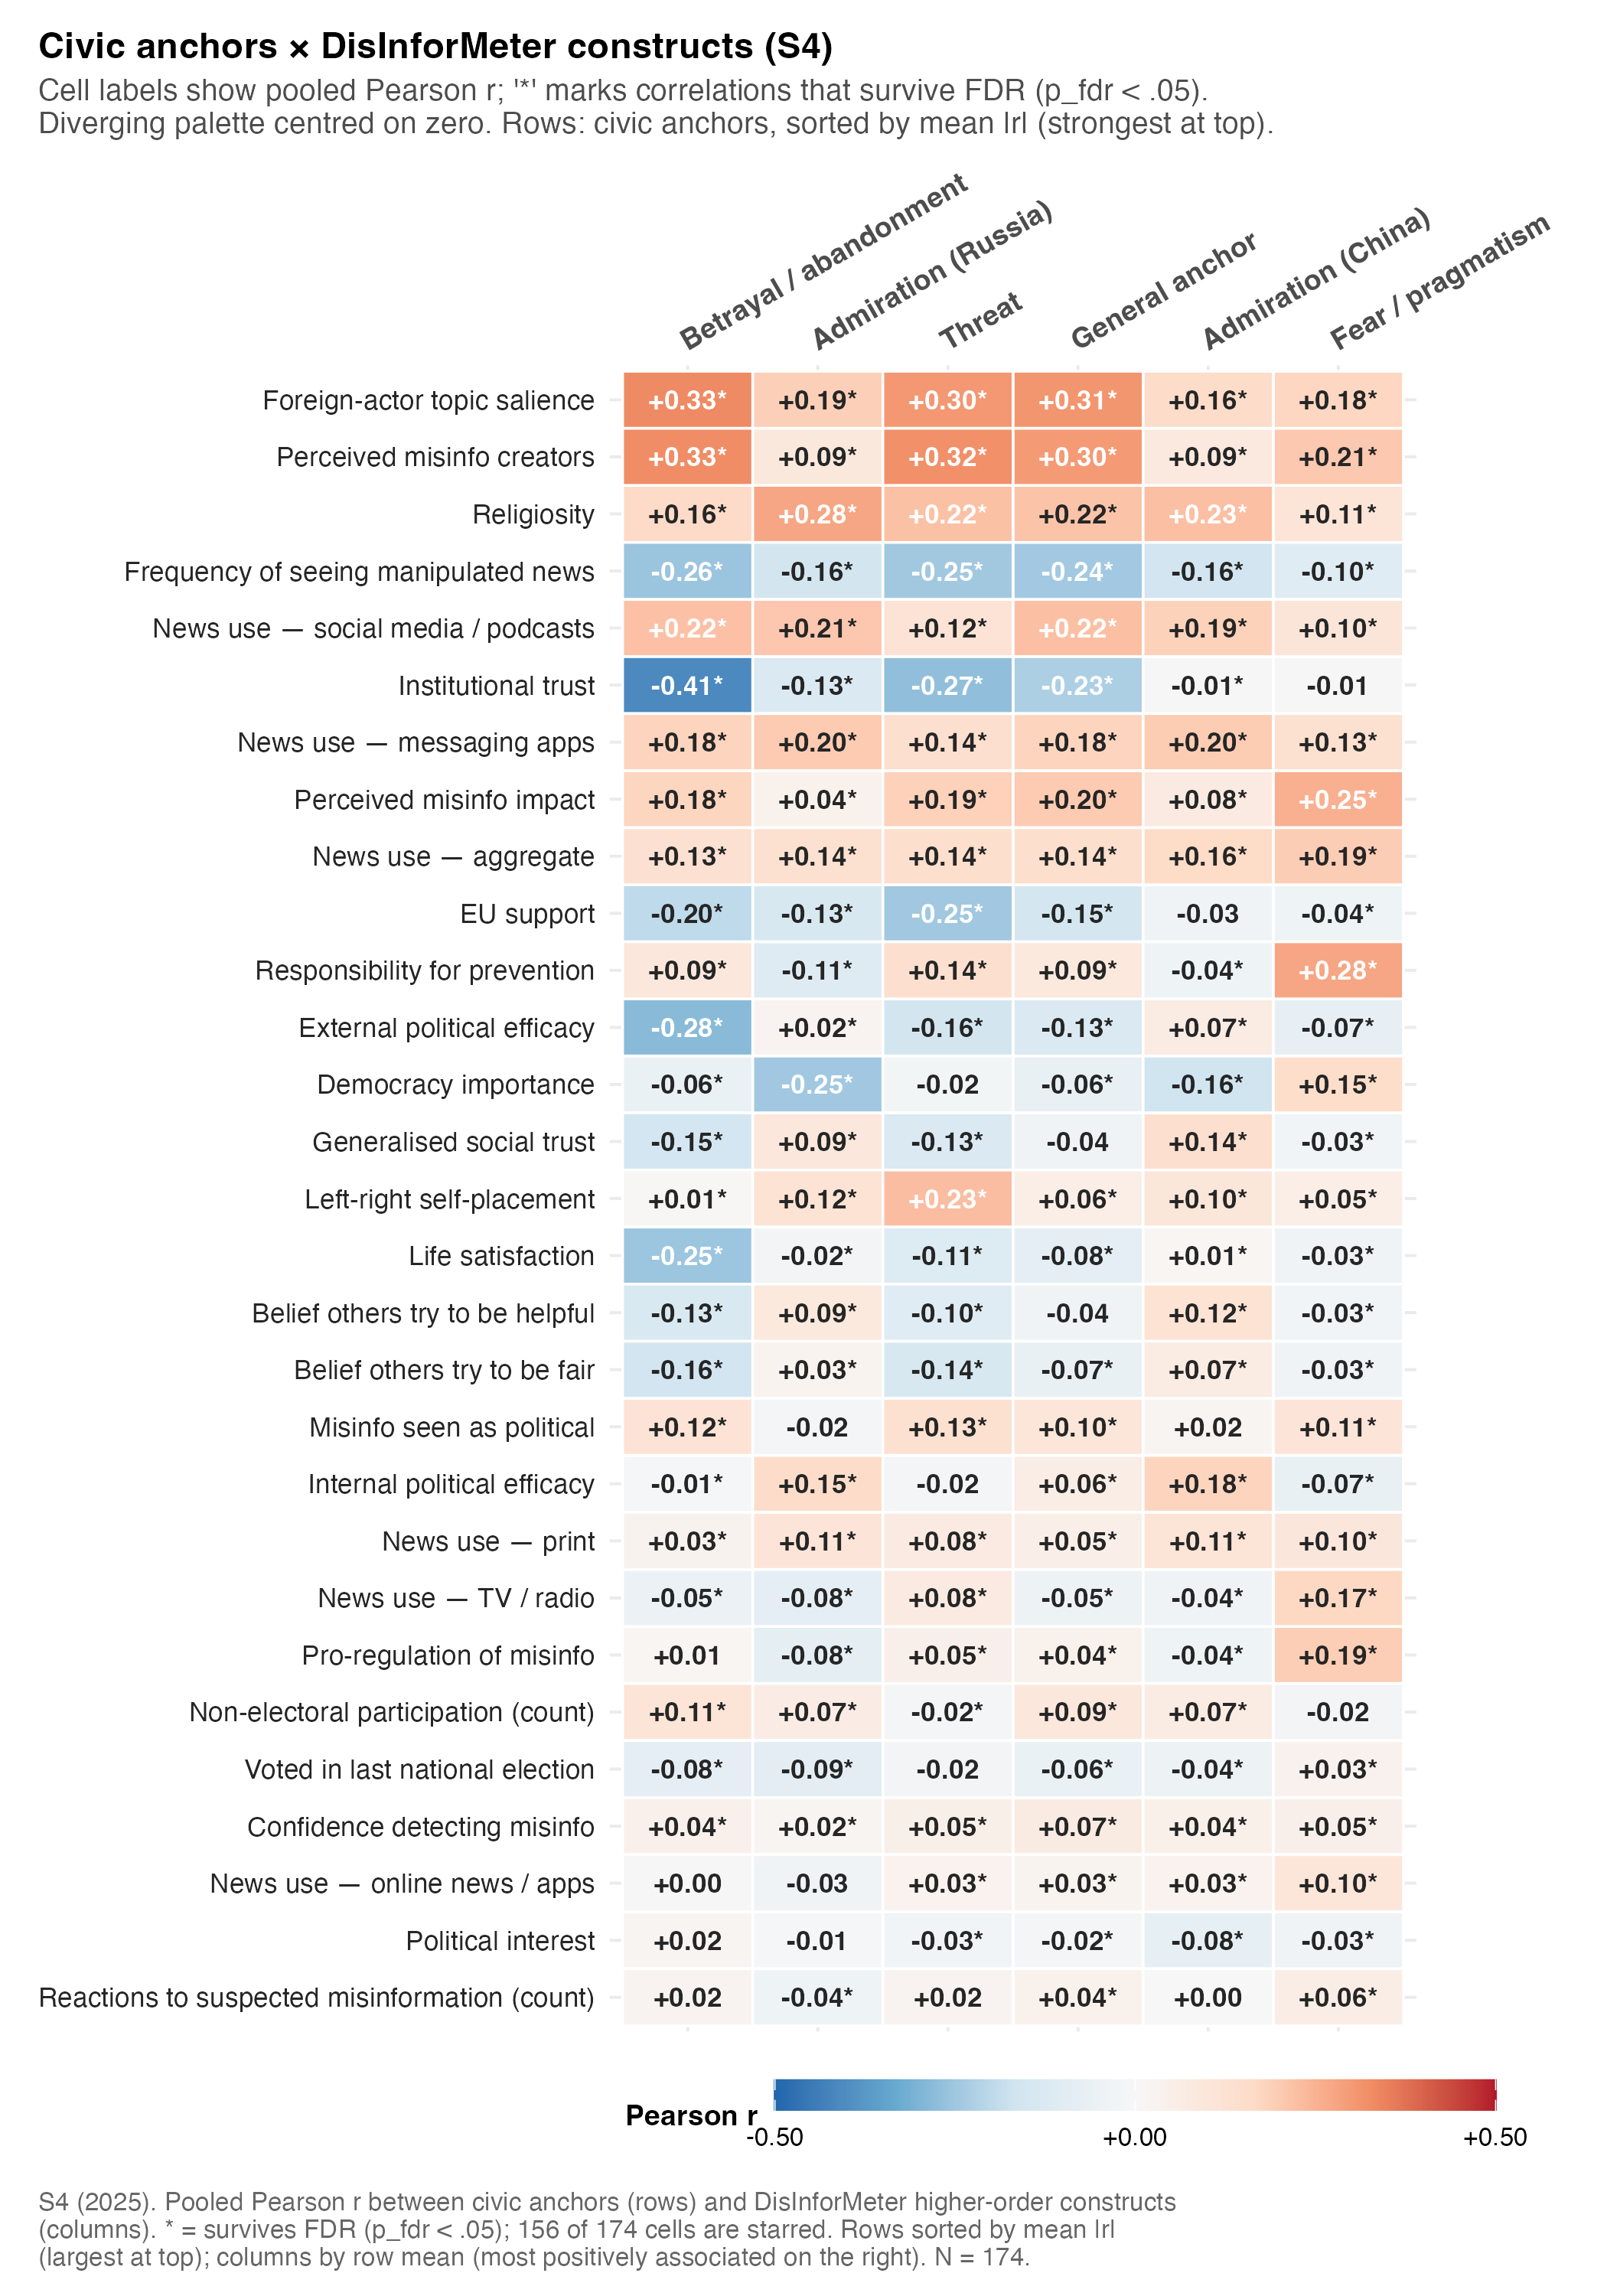
| F-20 | Civic anchor heatmap |
s4_anchor_correlations_wide.csv (via pivot_anchor_correlations_wide()) |
Skeleton |
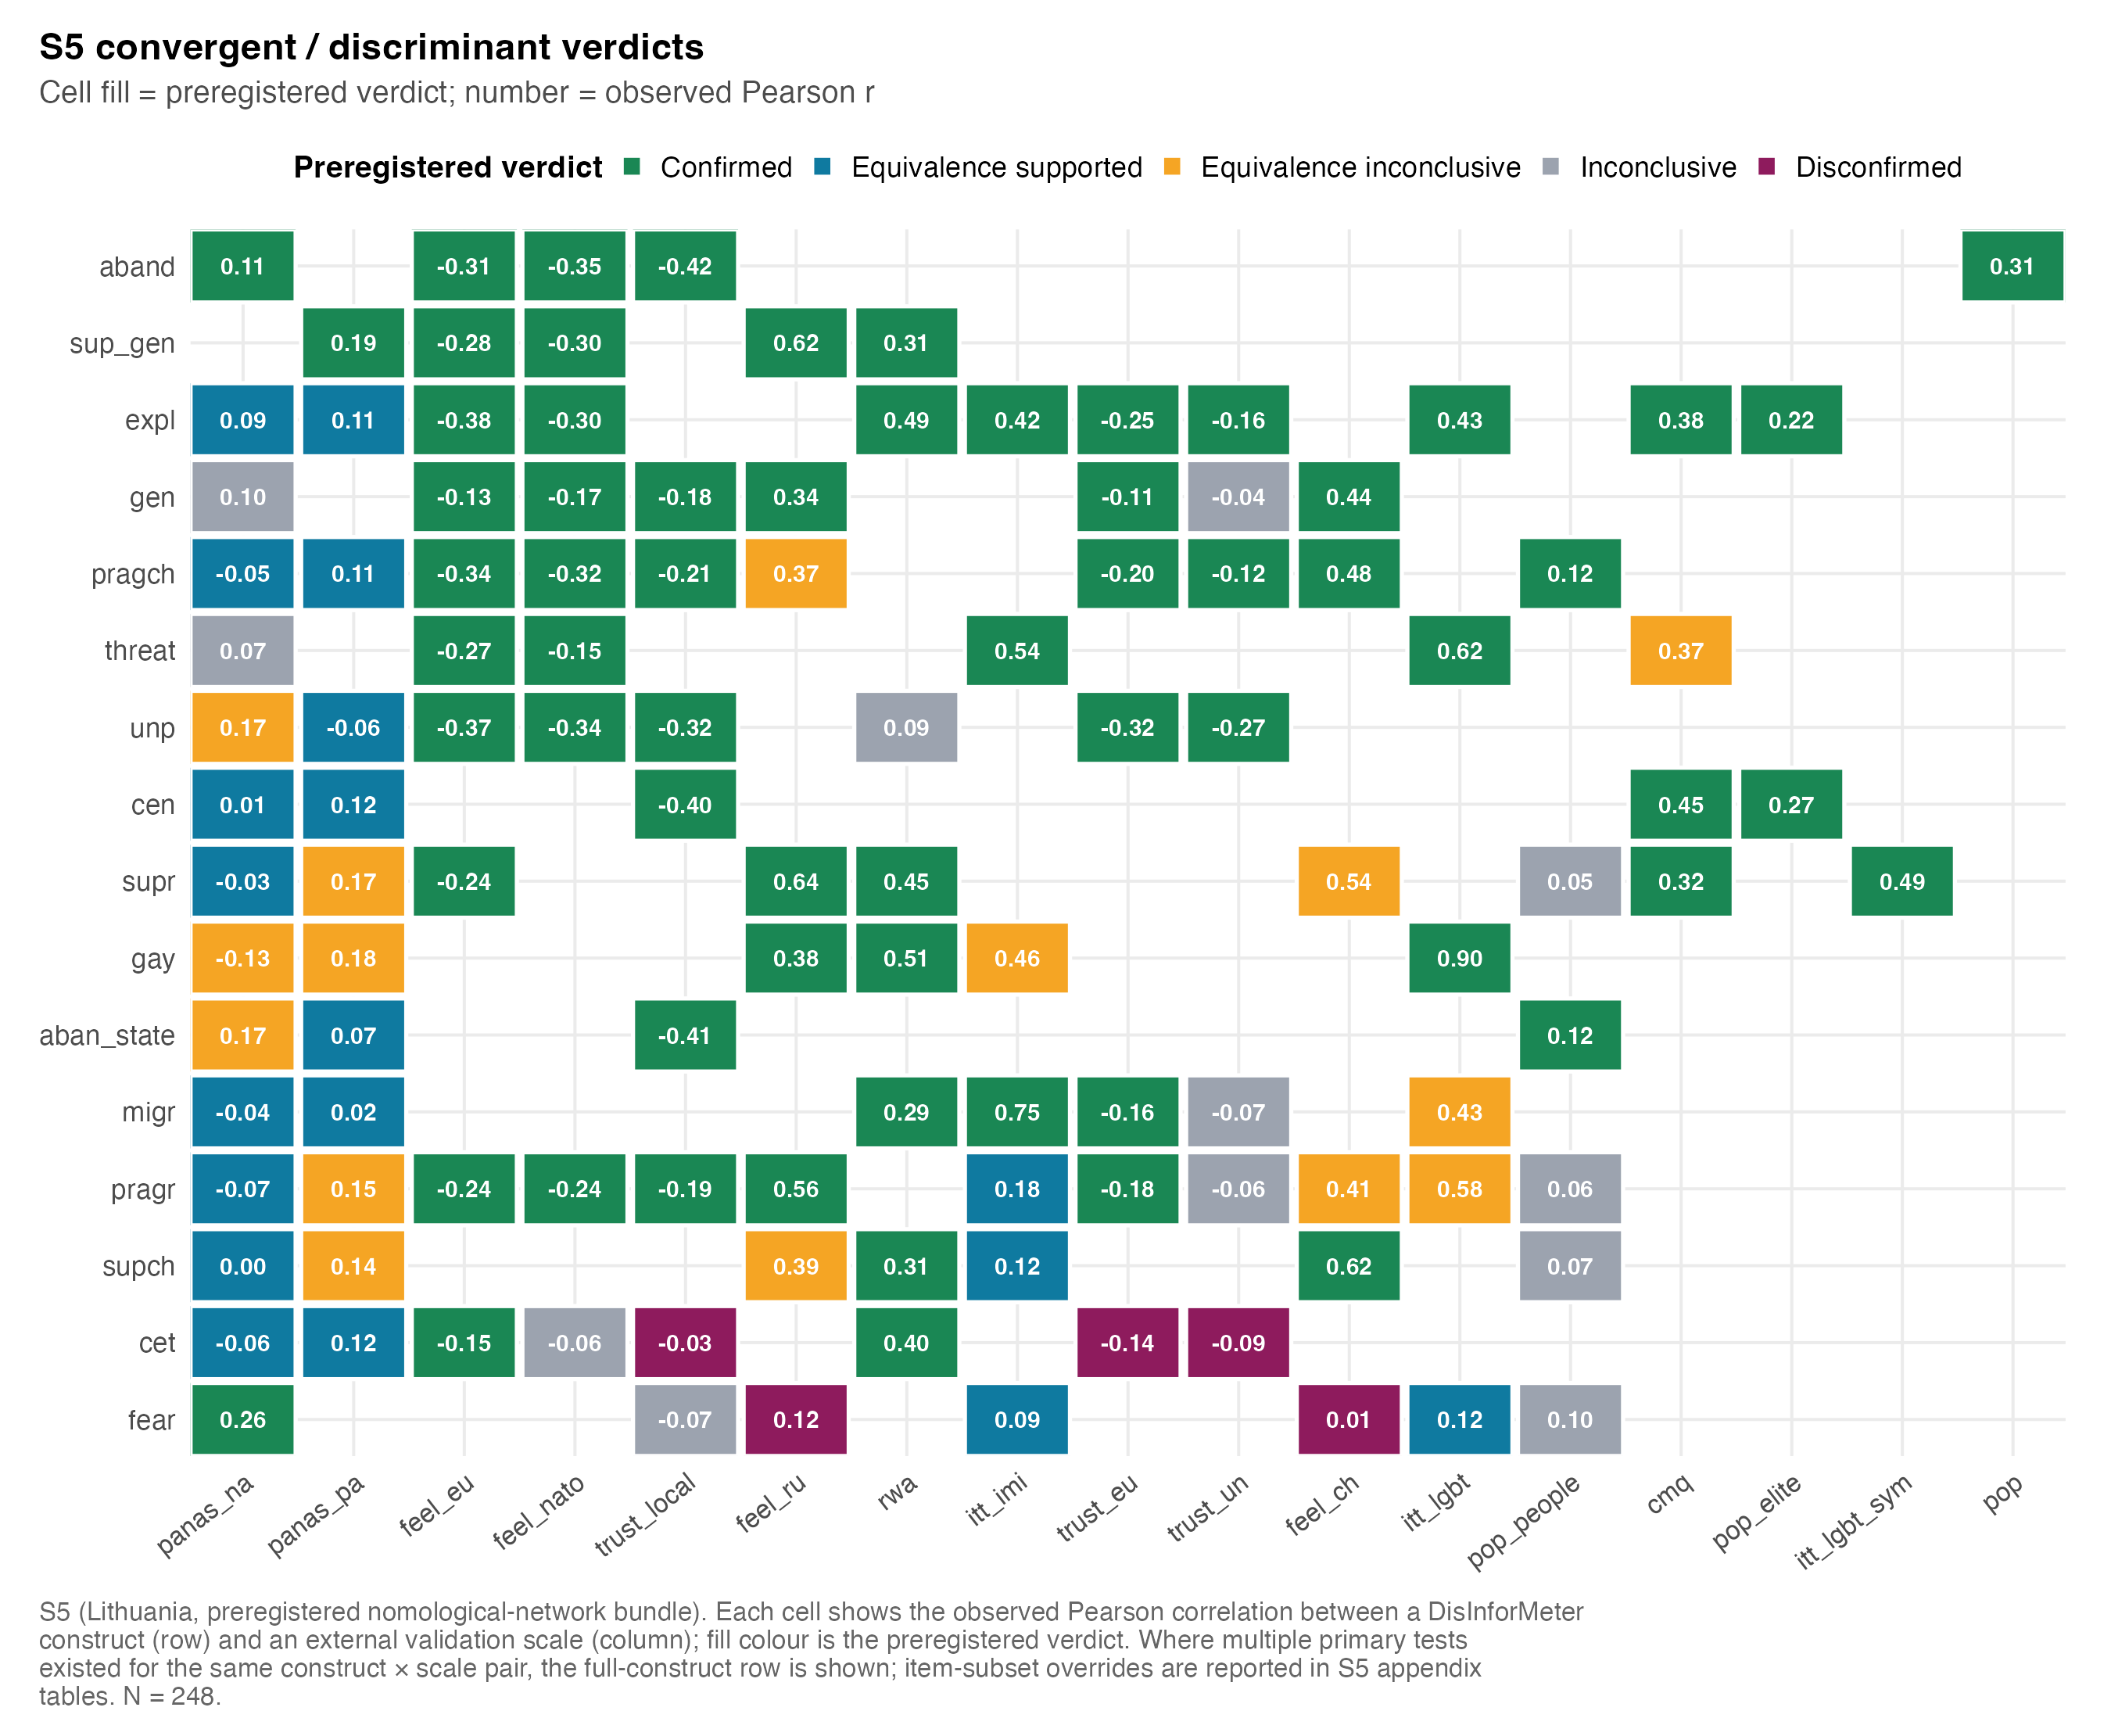
| F-21 | S5 preregistered hypothesis verdict panel |
outputs/figures/s5_validation_heatmap_verdict.png (already exists) |
Reuse |
Design source: docs/reports/2026-05-21_policy-report-content/02_figures-and-tables-spec.md F-18 to F-21 and 03_new-analyses-roadmap.md §§4, 7, 8.
Country-stratified predictor–FIMI alignment (feeds country snapshots in 7f)
For each S4 country with n ≥ 200, we report the bivariate Pearson correlation r(FIMI, predictor) for each of the five COMP higher-order predictors (GEN, THREAT, ABAND, FEAR, SUPF) on metric-invariant factor scores extracted from the pooled S4 COMP fit produced by 04c. Marginal rather than multivariate because at per-country N ≈ 600 the higher-order constructs are too collinear (THREAT–ABAND r = 0.94–0.99) to identify a stable multivariate slope structure — see §4.4 of the caveats register. The interpretation surfaced in the country snapshots is “what FIMI is most aligned with in this country”, not “what uniquely drives FIMI here”.
F-18 — Forest plot: higher-order predictors → FIMI
Replaces a four-page table. Predictor on Y, standardised β on X, point + 95 % CI, vertical zero reference. Facet grid: rows = study (S1, S2, S3, S4), columns = FIMI operationalisation (Full, Russian-origin, Chinese-origin, Short). Dim out non-significant points.
F-19 — R² lollipop across studies and FIMI versions
One row per study × operationalisation; R² on X.
F-20 — Civic anchor heatmap (the nomological heatmap)
Pivot of the existing s4_external_anchor_correlations.csv (174 rows) to wide form: rows = DisInforMeter construct, columns = anchor, cell = r_pooled, asterisk if p_fdr < .05. Divergent palette centred on zero; rows sorted by row mean.
F-21 — S5 preregistered hypothesis verdict panel
A copy lives at outputs/policy_report/figures/F-21_s5_verdict_panel.png (re-exported at print DPI from the original outputs/figures/s5_validation_heatmap_verdict.png).